


Debt doesn’t matter. Until it does. And now it does.
By Wolf Richter for WOLF STREET.
The U.S. national debt spiked by $572 billion since the debt ceiling was suspended two weeks ago after the sarcastically named “Fiscal Responsibility Act of 2023” was signed into law, the Treasury Department reported Friday evening. The total government debt now exceeds $32.0 trillion – hallelujah, we made it!
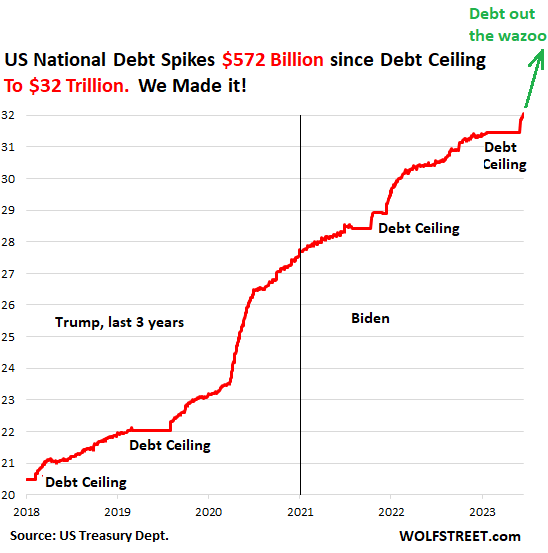
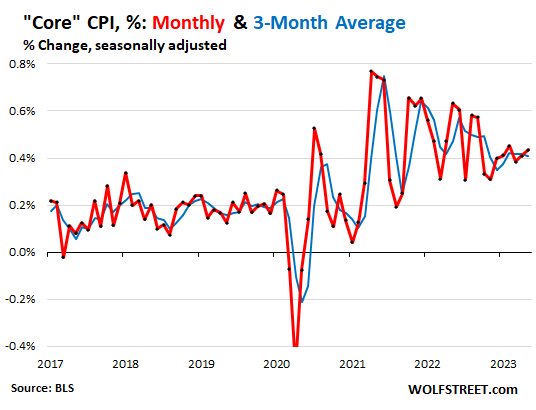
Debt doesn’t matter. Until it does. And now it does — in several ways, including interest on the debt, and fuel for inflation. Interest rates have come up because inflation started to rage in early 2021, and all this fiscal stimulus from deficit-spending is throwing fuel on the inflation fire, and so “core” inflation – inflation minus food, whose prices have ticked down, and energy whose prices have plunged – has been stubbornly stuck in the 5% range annualized for seven months, driven by inflation in services:
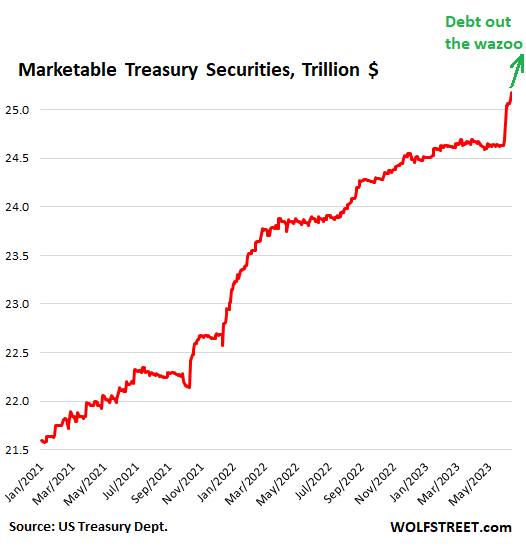
The US national debt comes in two types of Treasury securities, “nonmarketable” (cannot be traded in the bond market) and marketable (can be traded in the bond market).
“Nonmarketable” Treasury securities include the “I bonds” that Americans can buy – they pay a base rate plus a rate based on CPI. The Treasuries securities held by government pension funds, the Social Security Trust Fund, etc. are nonmarketable. These nonmarketable Treasury securities jumped by $96 billion since the debt ceiling was suspended, to $6.86 trillion.
“Marketable” Treasury securities spiked by $476 billion since the debt ceiling was suspended, to $25.2 trillion. These are the securities that the government sells via auctions to the public.
The Treasury Department is now selling a flood of Treasury securities to replenish its checking account that had been drawn down to near-nothing during the debt-ceiling standoff. These securities include a large amount of Treasury bills (with a maturity date in one year or less), short-term Cash Management bills (at the last CMB auction on June 13, it sold $45 billion in 42-day CMBs), and longer-term notes and bonds, including TIPS.
The Treasury General Account at the New York Fed, which is the government’s checking account, had fallen to a closing balance of $23 billion just before the debt ceiling was suspended – a hair-thin cushion, given the huge amounts that flow daily through this account. The default-day would have been sometime in early June. In this respect, this 2023 debt ceiling farce mirrored prior debt ceiling farces.
What flows into the TGA are tax receipts and the proceeds from selling Treasury securities. June 15 was also the deadline for quarter estimated taxes that corporations and self-employed have to pay. So there was a surge in the balance of the TGA.
Since the debt ceiling was suspended, the TGA has jumped by $227 billion – including the June 15 tax receipts – to a balance of $250 billion. But the tax receipts are going to get spent promptly, as they do every quarter.
Last year, the June 15 tax payments caused the TGA balance to jump by $140 billion. And a month later, the balance was down by $200 billion. Deficit spending will see to it that tax receipts are outspent at a very fast clip.
Massive bond issuance will be required in the near future, along with tax receipts, to:
- Replenish the TGA
- Pay off maturing securities
- Fund the ongoing blistering budget deficit.
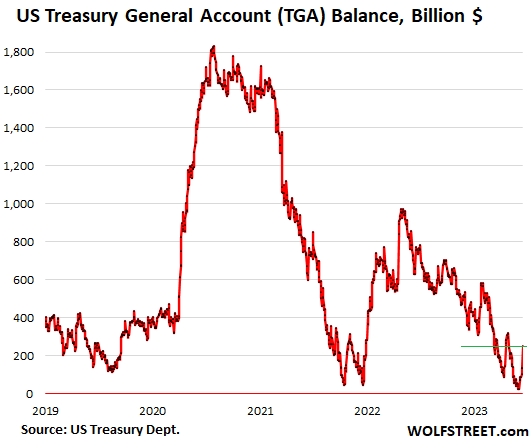
The huge bond issuance in the spring and summer of 2020 to fund the stimulus packages and other giveaways wasn’t all spent in 2020. The TGA peaked at $1.8 trillion in July and ended the year 2020 with $1.6 trillion. It was then drawn down to near-nothing during the two debt-ceiling farces in late 2021.
The $1.5 trillion drawdown of the TGA in 2021 moved $1.5 trillion in cash from the TGA (a liability on the Fed’s balance sheet) to the markets because the government was spending money it didn’t have to extract from the markets via bond issuance. This huge amount of liquidity to seep into the markets over a 12-month period explains in part the hot performance of the stock market in 2021.
From late 2021 through April May 2022, the TGA was being replenished and absorbed nearly $1 trillion, and markets tanked. There are always some lags. In June 2022, the S&P 500 began to bounce off in its up-and-down manner.
This $1 trillion in TGA drawdown from May 2022 through May 2023 in part counteracted the Fed’s QT that was phased in the summer of 2022.
Now the Fed’s QT is running for the first time simultaneously with the TGA being refilled, and both are draining liquidity from the markets simultaneously, and this is happening with some lag effects, amid the usual ups and downs.
Enjoy reading WOLF STREET and want to support it? You can donate. I appreciate it immensely. Click on the beer and iced-tea mug to find out how:

Would you like to be notified via email when WOLF STREET publishes a new article? Sign up here.
![]()