| Company | Value | Change | %Change |
|---|
The Sensex and Nifty registered their largest weekly decline in almost a month, falling 2% each. The Midcap Index bore the brunt, slipping nearly 6%, marking its steepest fall in over two months.
Out of the 50 Nifty constituents, 36 ended in the red. Shriram Finance, Trent, and NTPC were among the top losers, while TCS, Tata Consumer Products, HCL Tech, Wipro, and Britannia led the gainers. The broader market also struggled, with most midcap stocks closing lower. Kalyan Jewellers, PB Fintech, Paytm, and IREDA were some of the biggest decliners.
The Nifty 50 decisively breached its immediate support at 23,500, closing below its 10-day EMA. The index now hovers near a critical support zone of 23,350-23,270, with intraday charts hinting at an early reversal attempt.
The IT sector emerged as a bright spot, driven by strong results from TCS. The stock posted its biggest single-day gain in nearly six months, jumping 6% on upbeat commentary. Other IT stocks like Tech Mahindra, Wipro, Infosys, and HCL Tech also advanced. Analysts remain bullish on TCS following its December quarter earnings, with a consensus target suggesting a potential upside of 12.3% from current levels.
In the coming week, all eyes will be on corporate earnings, with HCL Tech, Reliance Industries, Infosys, Axis Bank, and Wipro scheduled to release their results. Additionally, key macroeconomic indicators, including CPI and WPI inflation data, will be closely monitored. Market sentiment will also depend on ongoing foreign fund flows and cues from US markets.
US stocks sold off on Friday, with the S&P 500 erasing its 2025 gains, after an upbeat jobs report stoked fresh inflation fears, reinforcing bets that the Federal Reserve will be cautious in cutting interest rates this year. Wall Street’s main indexes closed their second consecutive week in the red.
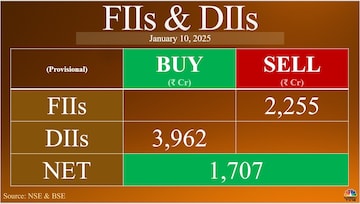
Foreign institutional investors (FIIs) were net sellers on Friday, while the domestic institutional investors (DIIs) were net buyers.

What do the Nifty 50 charts indicate?
According to Nagaraj Shetti of HDFC Securities, the underlying trend of Nifty continues to be negative amidst choppy movement. The next lower supports to be watched around 23260-23000 levels. Immediate resistance is at 23600 levels.
Om Mehra of SAMCO Securities believes the Nifty is precariously moving near its swing low of 23,263, and a breach of this level could accelerate the decline towards 23,110–23,000. On the upside, the resistance at 23,700 must be taken out for any meaningful relief rally.
The bearish pressure continues to intensify as the index closed below 23,500 for the first time in several days. The index remains below the crucial 50 EMA, reaffirming a bearish trend. Furthermore, the RSI remains in a negative crossover, signaling weak momentum. Sentiment stays subdued in the short term, with the potential for a decline toward 23,300 or 23,000. On the upside, resistance is observed at 23,550–23,600, said Rupak De of LKP Securities .
What do the Nifty Bank charts indicate?
The Nifty Bank index ended the session at 48,734.15, posting a decline of 1.55%. In a short-term effort to reclaim the 50,000 mark, Bank Nifty faltered and closed significantly below this critical level. Over the past week, Nifty Bank has shed 4.42%, with the downward trajectory becoming increasingly pronounced.
To initiate a meaningful recovery, Mehra said that Nifty Bank must decisively reclaim the 50,000 level, followed by two successive closes above it. This would be essential to establish a bullish outlook and counter the steep downtrend.


