
Patient baseline demographics and specimen handling
Our Molecular Twin Pilot (MT-Pilot) cohort included 74 patients at clinical stage I (n = 47) and II (n = 27) with surgically resected PDAC between March 2015 and April 2019. Tumor specimens were collected at the time of surgery and plasma specimens were collected preoperatively. DS was recorded and treated as a binary end point at the time of analysis as of 21 October 2021. At this time, 45 (61%) patients were deceased. All demographic and clinical characteristics (Supplementary Table 1) were included as features for the clinical analyte in our multi-omic analysis. The surgical pathology information was obtained from a pancreas tumor resection. Tumor and plasma specimens were assessed for individual features by molecular profiling, including targeted next-generation DNA sequencing (NGS), full-transcriptome RNA sequencing, paired (tumor and normal from the same patient) tissue proteomics, unpaired (tumor from patients and normal unrelated controls) plasma proteomics, lipidomics and computational pathology. Analyte profiling yielded features that we used to validate single- and multi-omic models for predicting DS; a leave-one-out cross-validation approach was applied to the MT-Pilot cohort, whereas the four independent datasets: TCGA, JHU cohort 1, JHU cohort 2 and MGH were used to validate our ML models and feature panels developed based on the MT-Pilot data (Fig. 1).
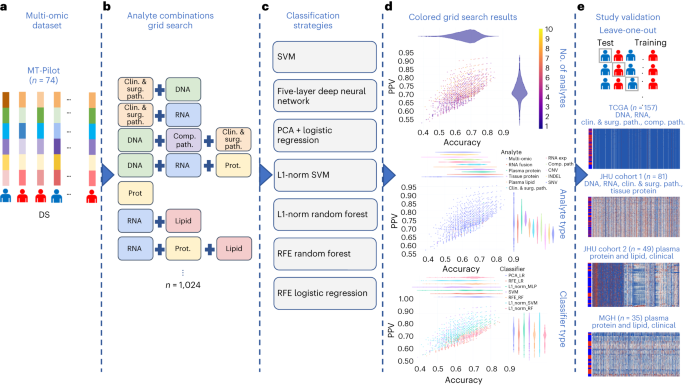
a, Combined multi-omic dataset of 6,363 processed features spanning clinical and surgical pathology, SNV, CNV, INDEL, RNA, fusion, tissue proteins, plasma proteins, lipids and computational pathology analytes. b, Construction of all possible analyte combinations (n = 1,024) via a drop-column importance approach to simulate availability of various combinations of analytes. c, For each analyte combination, seven independent ML models were trained for model evaluation, including SVM, principal-component analysis (PCA) + logistic regression, L1-normalized SVM, L1-normalized RF, five-hidden-layer deep neural network, RFE logistic regression and RFE RF. d, Input analyte combinations (n = 1,024) with seven modeling strategies per analyte combination produced 7,168 resulting grid search runs that were subsequently analyzed for predictive power, analyte composition and feature contributions for DS prediction. e, Each unique analyte combination and ML strategy was trained via leave-one-patient-out cross-validation approach. Single-omic and multi-omic models for DS prediction were validated using testing sets from four separate cohorts, TCGA, JHU cohort 1, JHU cohort 2 and the MGH cohort. Clin. & surg. path., clinical and surgical pathology; comp. path., computational pathology; prot., protein.
Source data
Clinical and surgical pathology features influence outcomes
The 331 clinical features, including surgical pathology features and chemotherapy treatment (Supplementary Table 1), as well as comorbidities (Supplementary Table 2) were analyzed using multiple ML models. When trained with these features, the random forest (RF) was the top performing model in determining DS and achieved an accuracy of 0.70 (95% confidence interval (CI) 0.60–0.81) and positive predictive value (PPV) of 0.71 (95% CI 0.60–0.82) (Table 1and Extended Data Fig. 1). The top features predicting outcome included comorbidities, such as hyperlipidemia, jaundice and pancreatitis, as well as surgical margin status (Supplementary Table 2), which are known in the PDAC field15,16,17. The model for DS was predominantly driven by comorbid conditions, which accounted for 306 of the 331 total features. The RF model was also trained using the remaining 25 features, which included known PDAC predictors such as previous chemotherapy and margin status. This model performed similarly to ones that included all clinical features (Supplementary Table 2). Notably, the top ten features of this model included surgical margin status, tumor grade and chemotherapy, which are known to influence patient outcome18,19.
DNA analysis reveals alterations with prognostic importance
Point mutations and insertion/deletion (INDEL) polymorphisms are common in established PDAC oncogenes and tumor suppressor genes20. Tissue samples were processed for 611 somatic single-nucleotide variants (SNVs), 648 copy-number variations (CNVs) and 126 INDELs. These features were then used in patient DS prediction models (Supplementary Table 3).
Using SNV features, the top-performing model to determine DS was RF, with accuracy of 0.64 (95% CI 0.53–0.75) and PPV of 0.66 (95% CI 0.55–0.77) (Table 1 and Extended Data Fig. 1). In models evaluating SNVs, we found that alterations in RAD51, IL6R, FGF20 and SOX2 genes were the top DS predictors (Supplementary Table 3) and their associated signaling pathways have important prognostic implications in PDAC21,22,23. In addition, we found genes, such as RIT1, that were top predictive DS markers identified by our model and not previously associated with PDAC prognosis or targetable pathways.
Using CNV features, the top-performing model to determine DS was an RF model with an accuracy of 0.65 (95% CI 0.57–0.80) and PPV of 0.68 (95% CI 0.57–0.80) (Table 1and Extended Data Fig. 1). The top CNV features for DS are noted in Supplementary Table 3. Notably, we found that FOXQ1 and KDM5D were top predictors associated with DS. Both are markers for PDAC prognosis and potential therapeutic targets24,25,26. In our cohort, the four commonly mutated genes, KRAS, TP53, CDKN2A and SMAD4 (ref. 27), were included among a total of 126 specific INDEL features and were learned by multiple ML model types. The top model predicting DS was RF with an accuracy of 0.64 (95% CI 0.53–0.75) and PPV of 0.70 (95% CI 0.58–0.82) (Table 1 and Extended Data Fig. 1). The top features in the model included mutations of TP53, CDKN2A and SMAD4 (refs. 28,29), which have been shown to correlate with poor prognosis and more aggressive phenotypes of PDAC.
RNA signatures of drug resistance impact prognosis
Whole-transcriptome sequencing was performed on 72 of the 74 formalin-fixed paraffin-embedded (FFPE) tumor tissue samples. To optimize the most predictive features, we first ran a differential expression analysis between cancer and noncancer samples from the GTex Consortium to select RNA gene transcripts for downstream modeling30. The top-performing model to determine DS was L1-normalized RF, which yielded an accuracy of 0.68 (95% CI 0.56–0.80) and PPV of 0.70 (95% CI 0.57–0.83) (Table 1 and Extended Data Fig. 1). In our top model for DS prediction the NFE2L2 and LRIG3 genes were the two top features (Supplementary Table 4). Recent investigations have shown that the NRF2 pathway through NFE2L2 regulates resistance to drugs and immunotherapy31,32. Additionally, a total of 29 RNA fusions were analyzed using multiple model types (Supplementary Table 4). The top performing model featuring RNA fusions to determine DS, was support vector machine (SVM) with an accuracy of 0.75 (95% CI 0.64–0.87) and PPV of 0.74 (95% CI 0.62–0.87) (Table 1 and Extended Data Fig. 1).
Plasma proteins are critical biomarkers in survival prediction
Proteomics and lipidomics analysis initially generated 3,777 tumor tissue proteomic, 1,051 plasma proteomic and 939 lipidomic features (Supplementary Table 5).
Using tissue protein features, the top performing model to predict DS was RF model with accuracy of 0.73 (95% CI 0.61–0.86) and PPV of 0.76 (95% CI 0.63–0.89) (Table 1 and Extended Data Fig. 1). For plasma protein features, the top-performing model for DS was the five-hidden-layer-deep neural network model with an accuracy of 0.75 (95% CI 0.63–0.86) and PPV of 0.80 (95% CI 0.68–0.90) (Table 1 and Extended Data Fig. 1). Among DS predictive plasma proteins, we identified ANXA1, which is an important emerging player in pancreatic carcinogenesis and PDAC drug resistance33,34. The top performing model using plasma lipid features to determine DS was the RF model with an accuracy of 0.71 (95% CI 0.58–0.83) and PPV of 0.74 (95% CI 0.61–0.87) (Table 1 and Extended Data Fig. 1). The top plasma lipidomics features for DS were driven by diacylglycerols and cholesteryl esters (Supplementary Table 5).
As discussed above, CA 19-9 is routinely utilized in clinical practice at PDAC diagnosis, pre- and postoperatively to assess disease biology, treatment response and prognosis. CA 19-9 readouts obtained at diagnosis, before surgery and postoperatively, were learned by the RF model, but the DS prediction had a low accuracy (0.59–0.64, 95% CI 0.47–0.76) and PPV (0.52–0.61, 95% CI 0.40–73) across all time points (Supplementary Table 6).
Predictive nuclear morphology via computational pathology
The 71 hematoxylin and eosin (H&E)-stained PDAC tissue whole-slide images (WSIs) were evaluated by a artificial intelligence (AI)-based computational pathology pipeline (Fig. 2). The pipeline included two convolutional neural network models: a model to mask-out cancer cells (Fig. 2a) and a model to delineate nuclei (Fig. 2b). When tested on images from an independent set of 40 PDAC cases, the cancer-masking model achieved 0.90 global accuracy, 0.784 mean intersection over union (mIoU) and mean F1-scores of 0.83 and 0.77 in identifying nontumor and tumor tissue pixels, respectively. Next, the pipeline was run on 2,908 regions (~41 ± 11 regions per case) randomly selected from the 71 WSIs in our cohort and automatically isolated 345,038 tumor cell nuclei (~4,860 nuclei per case). Nuclear morphology and texture were quantitated by a panel of 63 characteristics. Distribution of characteristics in each case was further summarized by 13 order statistics, yielding 819 features per case (Fig. 2c and Supplementary Table 7). A uniform manifold approximation and projection (UMAP) plot revealed clusters of cases with similar outcome (Fig. 2d) suggesting that some of the features in the panel bear prognostic potential. Using the leave-one-out approach and the 819 features per case, we cross-validated seven classification models for DS prediction. An RF with an accuracy of 0.66 (95% CI 0.55–0.77) and PPV of 0.76 (95% CI 0.63–0.88) (Fig. 2e) performed the best. Throughout all validation steps, features learned by the top models were ranked based on the impact on predicting the outcome and the frequency of occurrence of impactful features measured. Impactful features that occurred in at least 10% of validation steps were considered top features. The 17 out of 39 top features to predict survival in Fig. 2f originated from the same 10 out of 63 nuclear characteristics in Fig. 2c.
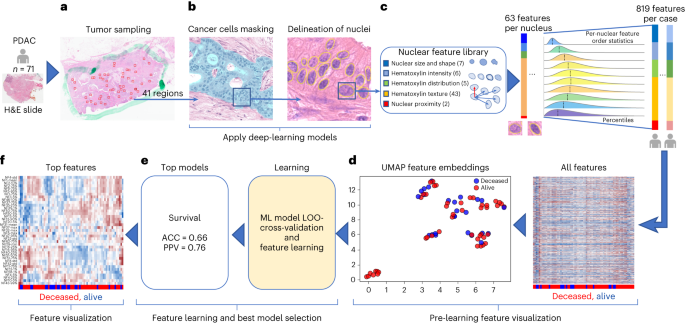
a,b, Images of random tumor nests selected by a pathologist in digital H&E slides (a) are sent for processing by deep-learning models to provide a mask of tumor cell nuclei (b). c, Downstream nuclear feature extraction and formation of order statistics of morphology and H&E staining features in nuclei under the mask in patients from the cohort. d, Patient-level visualization of extracted features by the clustergram (right) and UMAP feature embeddings (left) plots. e, Feature learning by multiple ML models using a leave-one-out (LOO) cross-validation strategy to identify the models that can predict survival with the highest accuracy. f, Visualization of the top features learned by top survival prediction models. The top features were selected based on the feature importance learned by the models.
Source data
To assess whether the computational pathology-based prediction of DS could benefit from the inclusion of percent of stroma or cancer to stroma ratio in our samples, we applied our pipeline (Fig. 2b) to the cancer regions marked by our pathologist (W.T.) and measured the proportion of tumor pixels (pCA), stromal pixels (pST) and the ratio of these two (r = pCA/pST) in the regions (Extended Data Fig. 2a,b). No statistically significant difference in pCA (t-test P value = 0.3) and r (t-test P value = 0.257) was found when tumors associated with poor survival (DS = 1, n = 28) were compared to those with better survival (DS = 0, n = 43). As no difference was observed, we did not incorporate the above features into the computational pathology analyte. Regardless, we found that the percentage of stroma is significantly larger in tissue after neoadjuvant therapy, which can occur following neoadjuvant therapy. Additionally, the percentage of cancer was smaller in tissue after neoadjuvant therapy, which is the intent of neoadjuvant therapy (Supplementary Table 8).
Multi-omic analysis suggests hierarchical complementarity
The 6,363 individual features from the single-omic sources were combined and analyzed using seven independent ML models cross-validated with a leave-one-patient-out technique (complete multi-omic feature dataset: Table 1 and Source Data Fig. 1). Each single-omic source and multi-omic combinations were evaluated using all ML models. The hyperparameters of each model were fixed at the initial design of the study to prevent over-optimization and overfitting due to the small cohort size. The top model for prediction of DS was the multi-omic model, which had an accuracy of 0.85 (95% CI 0.73–0.96) and PPV of 0.87 (95% CI 0.75–0.99), followed by single-omic analyte models that learned plasma protein, RNA fusions, tissue protein, plasma lipids, clinical and surgical pathology, RNA gene expression, computational pathology, DNA CNV, DNA INDELS and DNA SNV features in decreasing order of model prediction accuracy (Table 1 and Extended Data Fig. 1).
The accuracy and PPV performance yielded by single-omic models suggest that each single-omic analyte in isolation carries some predictive power and thus potential clinical utility. The best predictors of DS were plasma proteins leading to development of a model with an accuracy of 0.75 (95% CI 0.63–0.86) and PPV of 0.80 (95% CI 0.68–0.92). The model learning only presurgery CA 19-9 achieved an accuracy of 0.59 (95% CI 0.47–0.71) and PPV of 0.53 (95% CI 0.40–0.65) and it was considered the worst among all the single-omic models. As observed in the top two rows of the model performance (Table 1), the top multi-omic models outperformed the single-omic ones in accuracy (by 10–21%) and PPV (by 7–19%) in predicting DS, suggesting complementarity and information gain across analytes when combined under the multi-omic analytical approach. On the other hand, the multi-omic models had a larger dispersion of accuracy and PPV, when compared to the single-omic models (Table 1 and Extended Data Fig. 1) likely resulting from the involvement of a much larger set of features available for training.
The 1,024 individual analyte combinations (single and multiple) with all seven modeling strategies per analyte combination resulted in 7,168 grid search runs (Fig. 1). To establish per-analyte importance, the drop-column importance strategy was utilized and adapted, where each analyte’s set of features were dropped in their entirety. Using results from the 7,168 runs, we evaluated the model’s predictive performance, analyte composition and feature contributions (Fig. 3). Models trained with features from any 2–4 or 9–10 analytes were inferior in accuracy and PPV to the models trained with features from any 4–8 analytes (Fig. 3a).
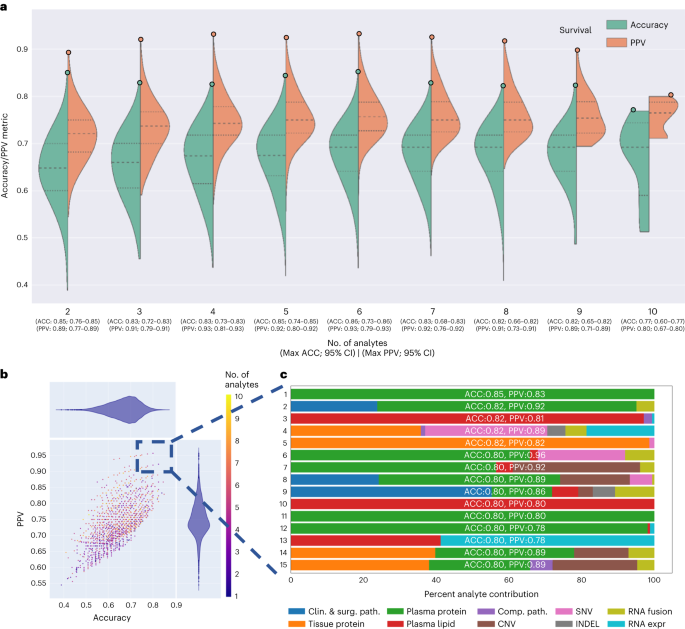
a, Asymmetric violin plots showing ACC and PPV distributions for multi-omic survival models, segmented by number of analytes in the multi-omic combinations. Green and orange dots represent ACC and PPV of multi-omic analyte combinations with increasing number of analytes right to left on the x axis. b, Multi-omic grid search model results for DS; number of analytes 1–10 represent plasma protein, RNA fusions, tissue protein, lipids, clinical and surgical pathology, RNA gene expression, computational pathology, DNA CNV, DNA INDEL and DNA SNV. The y axis shows PPV and the x axis shows ACC. c, Top 15 multi-omic models for prediction of survival with percent contribution of each individual analyte listed in order of descending accuracy.
Source data
Additionally, with the drop-column importance approach, we were also able to quantify the importance of each analyte category (Supplementary Table 9) and showed that the exclusion of any one analyte from the study generally reduced but did not substantially alter the performance; where the accuracy and PPV for DS prediction were in the range of 0.85–0.83 and 0.84–0.83, respectively.
Next, we focused on the top 15 multi-omic models for DS prediction (Fig. 3b), which were those with an accuracy >0.80 and PPV > 0.78. We plotted proportions of analyte’s features learned by each model (Fig. 3c) and observed that the top models had nearly similar accuracies and PPVs, however the proportions of contributing features varied across the top 15 models. The predominant feature contribution was from the plasma protein analyte (green bar, Fig. 3c).
Multi-omic models provide biological insights into PDAC
Given the relative paucity of predictive biomarkers and therapeutic advances in PDAC compared to other cancers, a notable exploratory objective of our study was to assess whether our platform can identify potential pathways and targets of therapy. Using a differentially expressed feature set, we were able to ascertain features to study objective Spearman correlations and the importance for all analyte features (Fig. 4a). By evaluating analyte contribution for each model, it was possible to generate ontology visualizations for protein, DNA and RNA as shown for the top multi-omic models for DS (Fig. 4b).
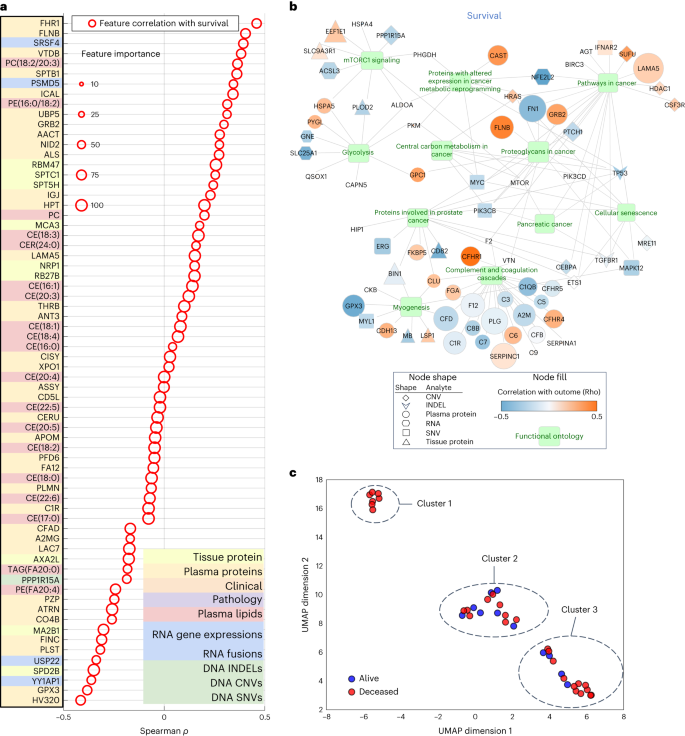
a, Spearman correlation of top multi-omic features with DS. Size represents a feature’s relative importance to the top multi-omic model; the red color indicates whether the feature importance pertains to DS. b, Gene Ontology network visualization for most informative features from the multi-omic models. Selected functional pathways containing gene sets from multi-omic analytes are displayed as green nodes, with associated genes and measured analyte types represented by a specific shape (based on analyte) and colored according to the strength of a given analyte’s correlation to the outcome variable of DS. Size of a given analyte node is relative to the frequency with which that analyte was selected for the models, with larger analytes more consistently selected and no visible node indicating that the analyte was not selected as important for the DS outcome displayed. c, UMAP clusters of patients using molecular signatures consisting of all 6,363 multi-omic features, colored by survival.
Source data
mTOR signaling, a known pathway in many tumors34,35 including PDAC, was found in the Gene Ontology network visualizations of the top multi-omic models36 (Fig. 4b). It has been targeted in PDAC alone and in combination with other agents37 with mixed results. Excluding mTOR, our Gene Ontology network visualizations revealed other clinically and biologically relevant pathways in PDAC, including glycolysis and cellular metabolism38,39.
To examine the relationship of tumor to outcome heterogeneity, all 6,363 features across all analytes were used to create patient-level clustering based on multi-omic molecular signatures and labeled for DS (Fig. 4c). Cluster 1 represents patients homogeneous for their clinical outcome (all deceased). To better understand the association of the heterogenous clusters, (2 and 3), with other clinical and computational pathology features, we compared the expression of a feature in one cluster to that in the two other clusters combined using t-test or Fisher’s test. This analysis revealed proportions of relevant features (P < 0.05) in each analyte (Supplementary Table 10), where except for computational pathology, no other analyte contained features that were present in all three pair-wise comparisons. Subsequently, we used one-way analysis of variance, which identified eight differentially expressed computational pathology features (Supplementary Table 11). These eight features were then analyzed by the Tukey–Kramer test for multiple comparisons. No feature was significantly different between the three clusters, but there were features that differed between two clusters. Furthermore, hierarchical clustering of 39 subjects characterized by the eight computational pathology features (Extended Data Fig. 3) suggested that they strongly contributed to the formation of clusters 1, 2 and 3. Together, these findings suggest that with more patients and with prospective iterative analysis over time, our approach will result in progressively more accurate predictions especially for patients who fit membership in specific clusters (for example, cluster 1) and deeper insight into what features are critical to individual patient clusters.
The parsimonious multi-omic models for disease survival
The complementarity of analytes observed in multi-omic models in Table 1 and Fig. 3, suggested that a parsimonious multi-omic model offering similar predictive performance to models with larger and more complex analyte compositions could be developed. If true, the global public health and societal impact would be consequential as it would potentially begin the process of democratizing precision cancer medicine, especially to areas of the world with limited financial and technical healthcare resources. To test this hypothesis, we started with the complete multi-omic feature space of 6,363 features and trained an RF model for DS utilizing a recursive feature elimination (RFE) strategy such that at each step the least-informative features were eliminated from further model iterations (Fig. 5a). Most notably, Fig. 5a highlights the inflection point of the ‘parsimonious model’ location on the curve (accuracy of 0.85, PPV of 0.85) learning only 589 multi-omic features. Further, the contribution of respective analytes to the parsimonious model remains mostly stable across iterations after the inflection point, with plasma lipids and RNA being the most relevant; however, note that plasma (proteins or lipids) alone can provide accurate prediction with fewer features. This opens the possibility that a screening of plasma could eventually be used for decision-making regarding pancreatic surgery.
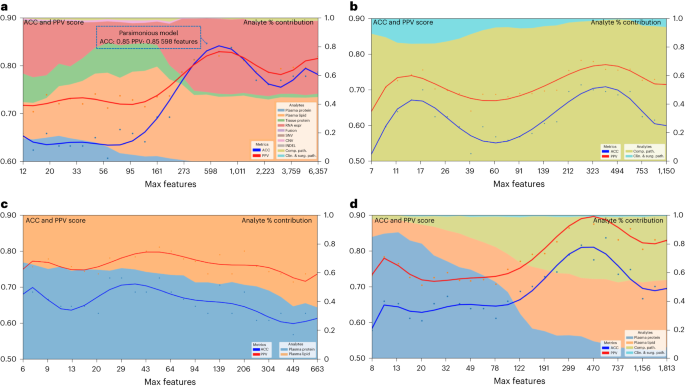
a, Parsimonious model of all multi-omic features and full dataset. The blue dotted line box indicates the parsimonious model at the inflection point. b, Clinical and surgical pathology and computational pathology analytes only. c, All plasma analytes (lipidomics and protein) only. d, All clinical and surgical pathology, computational pathology and plasma analytes (lipidomics and protein) only. Left y axis shows accuracy and PPV score: multi-omic model performance across feature reduction steps by restricting the maximum selectable features during model training. The x axis shows the number of maximum features at each reduction step. The right y axis shows the analyte percent (%) contribution: each analyte’s aggregated absolute feature weight contribution at each feature reduction step.
Source data
Trying to examine the potential of this approach for eventual globalization of precision oncology, we assessed specific limited analyte combinations and feature sets that could be applied to our parsimonious model. These analytes were selected based on criteria of standard availability (pathology specimens or clinical data including surgical pathology) or easily obtained (plasma lipids or proteins) as part of the diagnostic workup. Using this approach, we identified accurate parsimonious models that learned features from clinical, surgical pathology and computational pathology analytes (Fig. 5b), all plasma analytes (lipidomics and protein) (Fig. 5c) and clinical, combined with computational pathology and plasma analytes (Fig. 5d) and which had similar accuracy and PPV to the models that learned features from the entire set of 6,363 features in Fig. 5a.
Validation of RNA markers as predictors of survival
Whole-transcriptome sequencing and analysis was performed on 57 samples from our pilot cohort (Supplementary Table 4). Employing L1-normalized RF modeling, RNA gene transcripts significantly (P ≤ 0.05) predicting survival (n = 79) were used to develop gene signatures for improved (positive Pearson and Spearman rho for survival, n = 40 genes) and for poor (negative Pearson and Spearman rho for survival, n = 39 genes) survival (Supplementary Table 12). These two signatures were evaluated in an independent dataset of 177 PDAC patients40 for their ability to stratify DS. High score of the signature composed of genes whose expression was associated with poor prognosis in our data (n = 39) was also associated with poor DS in this set (hazard ratio (HR) = 2.17, (1.28–3.66), log-rank P = 0.0031) (Extended Data Fig. 4a), whereas that of genes whose expression was defined as a good prognostic in our data (n = 40), had a trend toward improved DS (HR = 0.74 (0.49–1.12), log-rank P = 0.15) (Extended Data Fig. 4b). We also performed gene set enrichment analysis on the RNA transcripts used in the two signatures above (n = 79). Enrichr41 found numerous significant pathways (Supplementary Table 13) implicated in PDAC resistance and treatment-targeting, including interferon signaling, AMP-activated protein kinase (AMPK) and CXCR4 signaling pathways42,43,44,45. Together, these data independently validate the clinical relevance of our RNA expression discoveries.
Validation of multi-omic models as predictors of survival
To further validate our single-omic, multi-omic and parsimonious analytes for DS prediction, we evaluated their predictive performance on the TCGA dataset, containing 157 evaluable samples that had at least one analyte type (Supplementary Table 1)46. As TCGA has data only on DNA, RNA, digital H&E slides and clinical analytes, our modeling had a reduced set of 3,423 total features compared to the 6,363 in our MT-Pilot cohort (Table 1 and Fig. 1e). The full 3,423 analyte model had an accuracy and PPV of 0.94 (95 CI 0.83–1.00) and 0.95 (95% CI 0.84–1.00) (Table 2 and Supplementary Table 14) for DS prediction with computational pathology, DNA SNVs and RNA gene expressions performing strongly in single-omic validation of DS (Table 2 and Supplementary Table 14).
Next, we examined the validity of our multi-omic parsimonious model on the TCGA dataset. Because this cohort had an overall reduced analyte set, we used an RFE strategy to retrain a RF model for DS on our cohort (MT-Pilot) and determined that the optimal (top of peak) parsimonious model employed 202 features out of 3,423 and had accuracy and PPV of 0.74 (0.63–0.85) and 0.77 (0.65–0.89), respectively (Extended Data Fig. 4c). Notably, when the model was applied to these same 202 features (Supplementary Table 15) in the TCGA dataset, it yielded an accuracy of 0.88 and PPV of 0.95 for DS prediction. Furthermore, in both our MT-Pilot cohort and the TCGA cohort, computational pathology and RNA gene expression were found to be primary analytes learned by the DS predicting models, with CNV and the clinical analyte providing minor additional improvement (Extended Data Fig. 4c). The signal dominance of RNA is not driven by expression of any single gene, but by a specific set of genes.
As TCGA lacked tissue proteomic level data, we sought an external dataset with tissue protein data, along with other critical single-omic informative analytes such as DNA, RNA and clinical data. We found an independent publicly available dataset14 named JHU cohort 1 that met these criteria. With DNA, RNA, clinical data and tissue protein analytes from our MT-Pilot cohort serving as the training set, we trained an L1-normalized RF model and applied it to this validation test set. This model predicted DS with an accuracy and PPV of 0.89 (95% CI 0.83–0.95) and 0.91 (95% CI 0.85–0.98), respectively (Table 2 and Supplementary Table 14). While a model trained on the tissue protein as a single-omic analyte had an accuracy and PPV of 0.56 (95% CI 0.50–0.63) and 0.53 (95% CI 0.47–0.60) in the JHU cohort 1 (Table 2 and Supplementary Table 14), addition of DNA, RNA and clinical analytes improved the predictive performance of the model and validated the multi-omics approach.
Validation of plasma proteins as a preoperative biomarker
Through our multi-omic and parsimonious modeling of the MT-Pilot cohort, we discovered that plasma protein is an analyte that provides not only accurate prediction of DS in PDAC, but does so with the fewest features compared to other analytes. As a result of these findings, as well as the poor performance of CA 19-9 as a preoperative marker for decision-making regarding the benefit of surgery, we next sought to validate our findings solely on analytes that would be available to the clinical practitioner before surgery.
Besides the TCGA and JHU cohort 1, we utilized two more cohorts; JHU cohort 2 and the MGH cohort (Supplementary Table 1). They included similar stage I/II resected PDAC with clinical and demographic data collected longitudinally and preoperative plasma samples, including CA 19-9 obtained and analyzed as described above. Application of the L1-normalized RF model trained on the MT-Pilot data on the two cohorts showed that plasma proteins remained highly predictive of DS in both validation cohorts, with accuracy and PPV of 0.98 (95% CI 0.83–1.00) 0.92 (95% CI 0.79–1.00), respectively in JHU cohort 2 and 0.89 (95% CI 0.76–1.00) 0.80 (95% CI 0.69–0.91), respectively in the MGH cohort (Table 2 and Supplementary Table 14). The addition of clinical data to plasma protein improves the multi-omics model for DS prediction. Overall, preoperative plasma protein was highly predictive of DS among three separate independent datasets and provided a unique preoperative biomarker with significantly better predictive performance than routinely utilized CA 19-9 (Table 2 and Supplementary Table 14).

