
Directed differentiation of hiPSCs (SBAD2) towards cardiomyocytes after exposure to teratogens and non-teratogens
To study the early events of the process of cardiomyogenesis, we used a cell monolayer-based directed hiPSC differentiation protocol, designated as the UKK2 cardiotoxicity test (UKK2-CTT), which is based on the sequential activation and inhibition of Wnt/β-catenin signaling [23] (Fig. 1A). The serial induction of differentiation with WNT signaling, with the small molecule Wnt/β-catenin agonist CHIR, leads to a transition from pluripotency (day0) to the three germ layers as demonstrated by our transcriptome findings at the end of day2 (Fig. 1B). As we previously described, using the hiPSCs (SBAD2 origin) we could discriminate almost all 23 teratogens (including 13-cis-retinoic acid (ISO)) from the 16 non-teratogens based on their transcriptomes at the end of day1 [24]. The teratogens and non-teratogens were applied in two concentrations, the plasma peak concentration (Cmax) and the 20-fold Cmax concentration [24]. According to the cardiomyogenic UKK2-CTT, CHIR was removed after 24 h incubation for the next 24 h (day2) and then IWP2 (Wnt/β-catenin small molecule inhibitor) was added to the medium for the following 48 h (day4) to facilitate the transition from mesodermal cells to cardiac progenitors at day4 of differentiation. At day4, aggregated forms of the cells began to emerge in the entire monolayer culture forming a network of branches. The contractile activity was observed at only random spots on day 8, whereas the entire cell monolayer network of cells was synchronously beating on day14 (Fig. 2A). The purity of cardiomyocytes at day14 was higher than >90 % by this differentiation protocol [2].
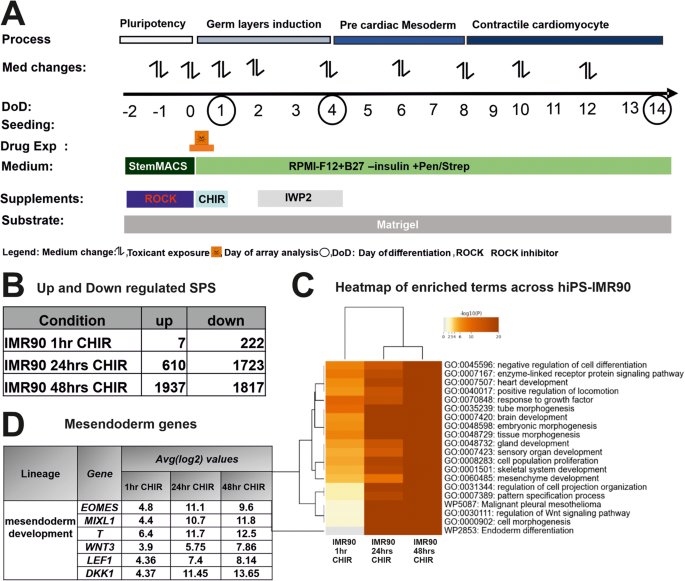
A Overview of the UKK2-CTT for the in vitro cardiac differentiation of the experimental design from day −2 to day14. B To determine the the early germ layer formation, hiPSCs were exposure to 1 hr, 24 h (day1) and 48 h CHIR (day2) compared with those of untreated controls. The hiPSCs were cultured as a monolayer on matrigel-coated plates for 2 days under pluripotent conditions and on day 0 exposed to GSK3 inhibitor, CHIR (10 µM) for 24 h. After microarray analysis of the RNA, the number of the up- and down regulated SPSs (log2 fold change > 1; adjusted p‐value < 0.05) were determined. C Visualization of enriched gene ontology terms across IMR90 1 h, 24 h and 48 h after CHIR. Heatmap showing the top 20 enrichment clusters, colored by p-values. D Mesendoderm gene table Representative mesendoderm genes increased gradually for the different time points, after exposure to CHIR in IMR90-hiPSCs.
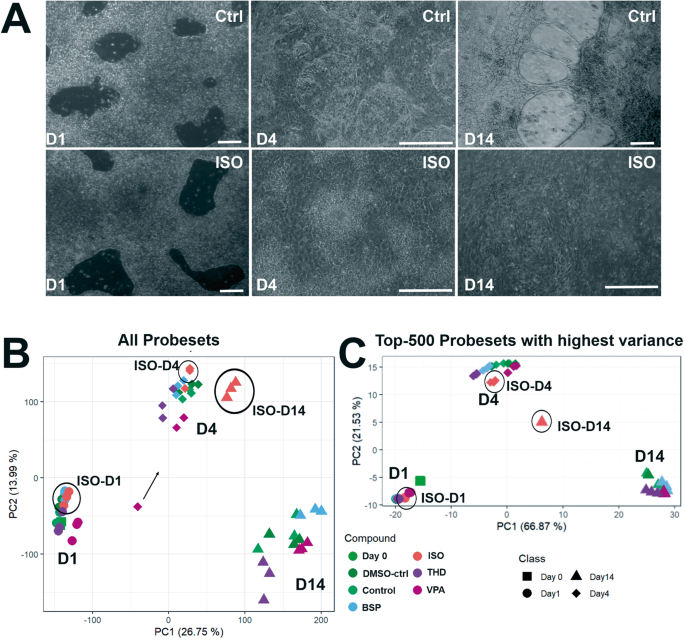
The hiPSCs were cultured as a monolayer on matrigel-coated plates for 2 days under pluripotent conditions and on day 0 exposed to GSK3 inhibitor, CHIR (10 µM) for 24 h. After 48 h exposed to Wnt inhibitor, IWP2 (5 µM). Spontaneously beating cardiac clusters were observed from day 9 onwards. Simultaneously, cells were exposed to test substances for a single exposure of 24 h (day1). The cells were harvested for gene array analysis on day1, day4 and day14 (Fig. 1A). Medium changes were done as indicated every alternate date. A Representative phase-contrast images of control and ISO treated hiPSC at day1-, 4 -and 14day. Scale bar, 100 µm. B PCA blot of 54,675 probe sets for three timepoints during the differentiation. C PCA blot of the 500 SPS with the highest variance across the mean of the condition‐wise samples. The respective day is indicated by the shape and the respective measured compound is indicated by the color of the dot, as labels are shown next to the plots. The distribution of the data points on the x-axis is given by the PC 1 and on the y-axis by PC2. The percentages in parentheses denote the proportion of explained variance for the respective PC.
Interestingly, among all teratogens and non-teratogens the teratogens (Table 1) ISO, 9-cis-retinoic acid (RA) and Acitretin that are known to act through the retinoid receptors (RR), completely inhibited the cardiomyogenesis process, since no beating cluster and no spontaneous beating areas could be identified and cardiac sarcomere was absent.
Directed differentiation of hiPSCs (IMR90 origin) towards cardiomyocytes after exposure to isotretinoin, thalidomide and valproic acid
To further discriminate the impact of RR activation for the teratogens specifically inhibiting cardiomyogenesis in differentiating IMR90 hiPSCs, four test compounds were chosen, among them ISO (as a gold standard in our study), Valproic acid (VPA) and Thalidomide (THD) as well as Buspirone (BSP) as a non-teratogen. To identify the optimal time for early germ layer formation induced by CHIR through activation of the canonical Wnt/β-catenin signaling pathway to mesoderm and further to cardiomyocytes, we compared the transcriptomes at 1 h, 24 h (day1) and 48 h (day2). The hiPSCs were cultured in the presence of CHIR for 1 h, 1 day (day1) and then CHIR and cells were cultured for further 24 h in the absence of CHIR (day2). The number of the differentially expressed genes (significant probe sets, SPS) increased proportionally with the incubation time (Fig. 1B). In the presence of CHIR for 24 h (day1), 610 SPS were significantly up and 1723 SPS were significantly downregulated. GO analysis of the DEGs (Fig. 1C) indicated that several developmental pathways such as: -embryonic morphogenesis-, – heart development (mesodermal origin), -brain development (ectodermal origin and partial gland development (endodermal origin) were significantly enriched at these time points. This observation was confirmed by the strong deregulation of mesoderm genes such as T (Brachyury), EOMES, and MIXL1, three classical and conserved mesodermal factors that control the exit of pluripotency and germ layer segregation [26]. WNT3, LEF1 and DKK1, markers for initiating the process of cardiomyogenesis, were also highly upregulated (Fig. 1D, table). These findings indicate the high activation of several differentiation processes that recapitulate embryonic development. Moreover, the findings suggest that the initiation of germ layer formation occurred at day1 of differentiation. Therefore, to identify the cardiomyogenic pathways in hiPSCs, we performed transcriptomic analysis after differentiation of the hiPSCs for 1, 4 and 14 days in the presence and absence of the three selected teratogens (ISO, VPA, THD) and one non-teratogen (BSP). Among them, ISO has been shown as a clear inhibitor of cardiomyogenesis in hiPSCs (Fig. 2A, control and ISO morphology). RNA samples were harvested at day1 (initiation of germ layers), day4 (early cardiac progenitor cells) and day14 (CMs). As shown in Fig. 2A, in contrast to the control cardiomyocytes (day14), which indicated beating clusters of cardiomyocytes, day14 differentiated ISO-treated hiPSCs showed a static morphology without any beating clusters of cardiomyocytes. To obtain an overview of genome-wide gene expression alterations induced by the different test compounds, principal component analysis (PCA) was performed based on all 54,675 analyzed probe sets (Fig. 2B) and based on the top 500 with the highest variance (Fig. 2C). The principal components PC1 and PC2 explain the shown percentages (%) of the variance of the transcriptomes at the different differentiation periods (Fig. 2B, C). The three replicates for each time point clustered relatively closely together suggesting a good reproducibility of the microarray data. The transcriptomes of the ISO-14-day triplicate were the only ones that exhibited a noticeable separation from the control, VPA-, THD-, and BSP-14-day triplicate transcriptomes in the PC1 direction, indicating that ISO had an impact on cardiomyogenesis. (Fig. 2B). A clear separation of the ISO-14-days transcriptome in both PCA directions was observed taking in consideration the top 500 SPS with the highest variance (Fig. 2C).
To compare the differences between the 3 teratogens (ISO, VPA, THD) and the non-teratogen BSP at different periods of differentiation, we performed a new PCA with the 1000 SPS with the highest variance (Fig. 3A–C) for each differentiation time point. As indicated the day1, day4 and day14 transcriptomes of BSP cluster together with the appropriate transcriptomes of the control (without DMSO) and DMSO-control (end concentration 0.1%). Interestingly, a clear separation of the transcriptomes of the three teratogens (ISO, VPA and THD) was observed at all three differentiation time points (Fig. 3A–C). Genome‐wide expression changes were also illustrated in volcano plots for a comparison of selected test compounds day1, day4, day14 vs the appropriate controls (DMSO-control, day1, day4 and day14) respectively, (Fig. 3D–F), (at least 2‐fold deregulated; FDR p‐value < 0.05). In general, a large number of SPS was obtained for the teratogens, in particular for ISO, whereas none was observed for the non‐teratogen BSP. Interestingly, on day1 and day4, the two other teratogens, THD and VPA, showed also a high number of deregulated genes. Nevertheless, the number of developmental genes for ISO at day4 and day14 was much higher than the genes deregulated by VPA and THD, correlating with the complete inhibition of cardiomyogenesis by ISO.
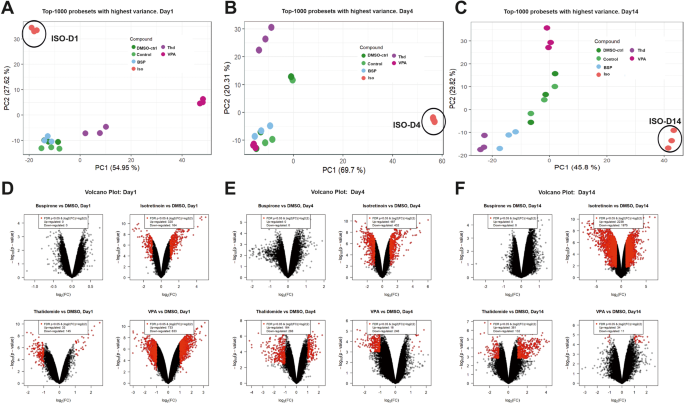
Comparison of the top1000 SPS with highest variance for ISO-, THD- and VPA-treated vs control day1, day4, and day14 differentiated hiPSCs (IMR90). A–C PCA-plots for each day, respectively. The different compounds are indicated by different colors. The distribution of the data points on the x-axis is given by the PC 1 and on the y-axis by PC2. The percentages in parentheses denote the proportion of explained variance for the respective PC. D–F Volcano plots of deregulated SPS for ISO-, THD- and VPA-treated vs control day1, day4, and day14 differentiated hiPSCs. Each dot represents one out of 54,675 probe sets from the Affymetrix gene chips. The fold‐ change of the differentially expressed probe sets in substance‐exposed cells is given on the x‐axis in log2‐values, and the corresponding p‐values of the limma‐analyses are given on the y‐axis in negative log10‐values. Red dots represent SPS with a statistically significant, FDR‐adjusted p‐value < 0.05 and an absolute fold‐change > 2. The numbers of up‐ and downregulated red‐dot‐probe sets are indicated.
Identification of differentiation processes at day1 of hiPSCs (IMR90) differentiation affected by isothretinoin, valproic acid, thalidomide and buspirone
To study the biological significance of the differentially expressed genes, we compared the SPS (FDR p-value < 0.05; log2 fold change ≥ 2), of ISO when compared to others (VPA, THD and BSP), during the transition through mesoderm at day1. The ISO-specific exposure led to 273 (94 downregulated and 173 upregulated) SPS (FDR p-value < 0.05; log 2fold change ≥ 2) (Fig. 4A, B). To characterize the biological functions of genes deregulated by the three teratogens at day1, the up-and downregulated SPS were separately analyzed by the Metascape functional enrichment tool [27]. No deregulated SPS were identified by BSP as a non-teratogen.
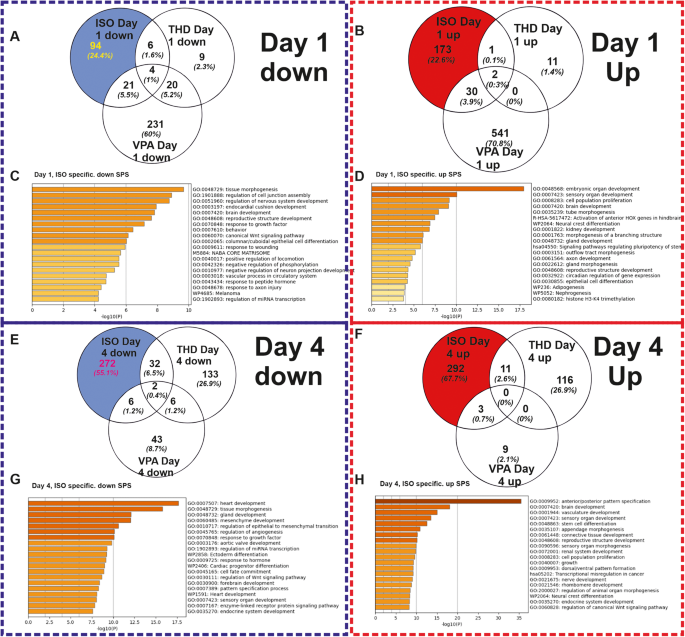
A, B The Venn diagrams shows the number of down-regulated and up-regulated SPS (log2 fold change > 1; adjusted p‐value < 0.05), respectively induced by the selected compounds. C, D Metascape analysis for specific ISO-induced downregulated and upregulated SPS, respectively. Analysis shows the statistically enriched BPs and pathways as colored by the p values. E, F The Venn diagrams shows the number of down-regulated and up-regulated SPS (log2 fold change > 1; adjusted p‐value < 0.05), respectively induced by the selected compounds. G, H Metascape analysis for specific ISO-induced downregulated and upregulated SPS, respectively. Analysis shows the statistically enriched BPs and pathways as colored by the p values.
The GO analysis of the ISO-specific downregulated genes recognized enriched GOs such as -tissue morphogenesis-, -regulation of nervous system development-,- endocardial cushion development -and the -canonical Wnt pathway signaling- (Fig, 4C). The corresponding genes belonging to these GOs are shown in Supplementary Fig. S1A (Supplementary Fig. S1A). The KEGG analysis reveals pathways such as Ras and PI3k-Akt Signaling (Supplementary Fig. S1B). Analysis of the ISO-specific upregulated SPS recognized prominent general early developmental GOs, such as -embryonic organ development-, -brain development-, -activation of anterior HOX genes in hindbrain, -neural crest differentiation- (Fig. 4D). The table with the GO genes (Supplementary Fig. S1C) reveals the genes that are related to the above-mentioned significant processes and KEGG pathways (Supplementary Fig. S1D), such as -signaling pathways regulating pluripotency-, -TGF-beta signaling- (all having a crucial role during general developmental processes).
The most prominent enriched GOs with their particular genes of the downregulated (Supplementary Fig. S1A) and upregulated genes (Supplementary Fig. S1C) are presented, respectively. As anticipated, critical genes necessary for heart development, such as BMP2, DKK1, EOMES, and GATA4, were identified within the canonical Wnt signaling pathway. Notably, the expression of these genes involved in heart development was downregulated following ISO-day1 treatment. Analysis of the upregulated genes at ISO-day1 (Supplementary Fig. S1C) resulted in the identification of general developmental GOs such as – pattern specification processes, -heart development-, and -brain development- (genes of the specific GOs are shown in Supplementary Fig. S1C table). The analysis of the top 50 genes specifically down- and upregulated by ISO (Supplementary Fig. S2A, B) revealed significant GO terms associated with the observed effects. These findings suggest a suppression of cardiomyogenesis and the initiation of neurogenesis as prominent biological processes influenced by ISO treatment. As indicated the Wnt signaling that normally is activated by CHIR in DMSO-control is downregulated in ISO-treated hiPSCs. Validation of the microarray data at day1 was performed with five arbitrarily selected genes by qPCR. The qPCR data analysis confirmed the deregulation pattern of these genes (in square with star, see Supplementary Fig. S2C) and underlined the significant deregulation of ISO-treated conditions when compared to the other three compounds.
Identification of differentiation processes at day4 of hiPSCs (IMR90) differentiation affected by Isotretinoin, VPA, Thalidomide and Buspirone
A similar analysis was performed by analyzing the ISO-specific deregulated genes at day4, which recapitulates the transition from cardiac mesoderm differentiating towards cardiac progenitors. ISO-specific set exposure led to 574 (272 downregulated and 292 upregulated) SPS (FDR p-value < 0.05; log2 fold change ≥ 2) (Fig. 4E, F). The downregulated genes were classified to GOs mainly associated with mesoderm-derived organs such as -heart development-, and ectoderm-derived organs such as -brain development- (Fig. 4G). The table with the GO genes (Supplementary Fig. S3A) shows the genes of the heart-related downregulated enriched terms and the KEGG pathways such as -TGF-beta signaling-, -dilated cardiomyopathy- and-hypertrophic myopathy- (Supplementary Fig. S3B).
The upregulated genes are enriched in GOs that mainly are involved in the -anterior posterior patter specification- processes, -brain development and other early morphogenesis-developmental processes (Fig. 4H) additional the table with the GO genes (Supplementary Fig. S3C) and KEGG pathways associated with Hedgehog-, Hippo-, Wnt and pluripotency regulating signaling pathways (Supplementary Fig. S3D). The top 50 ISO-specific upregulated (Supplementary Fig. S4A) genes belong to GOs which are crucial for pattern specification processes whereas the downregulated (Supplementary Fig. S4B) are involved in signaling pathways inducing heart development. Validation of the microarray data at day4 was done by the expression of 7 arbitrary genes using qPCR. The qPCR data analysis confirmed the deregulation pattern of these genes (Supplementary Fig. S4C).
Taken together, the analysis of ISO specific set on day1 and day4, revealed that genes represented by the GO terms -heart Development-, and signaling pathways including Wnt/β-catenin, TGF beta, BMP signaling, which are all known to regulate mesodermal differentiation, are potential biomarker candidates for a successful transition towards mesodermal state and play a key role for fate specification in the heart development.
The significantly deregulated VPA-specific genes at day1 and the THD-specific deregulated genes at day4 were also analyzed by Metascape. Heart development GOs are provided in the Supplementary Fig. S5 (Supplementary Fig. S5A–K). Since at day14 we got beating clusters of cardiomyocytes we may conclude that VPA and THD have no significant effects on mesoderm-depending cardiomyogenesis but may partially inhibit the development of functionally intact cardiomyocytes.
Identification of a shared pattern after Retinoid exposure between two different hiPSC lines
Next, we compared the transcriptomes of the 3 retinoids (Acitrecin, 9CRA and ISO) in the SBAD2 hiPSCs [24] with the transcriptome of ISO in IMR90 hiPSCs at day1 of differentiation (Fig. 5). In this context, the three retinoid compounds completely inhibited the cardiomyogenesis as observed at day14 when we differentiated the SBAD2 hiPSCs and the IMR90 hiPSCs in the presence of ISO.
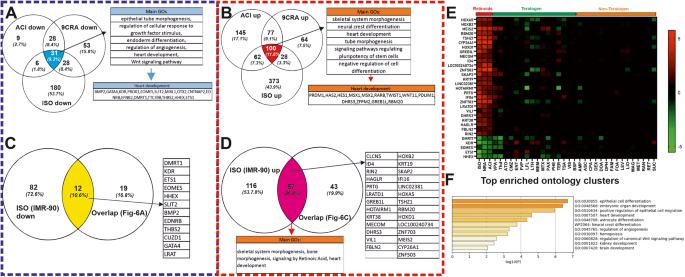
A, B Venn diagrams show the number of common retinoids specific (ISO; 9-cis-retinoic acid: 9CRA and Acitretin: ACI) downregulated and upregulated genes, respectively, in SBAD2 hiPSC at day1. The commonly down- and upregulated genes (31 and 100 respectively) were analyzed by the Metascape tool to identify the statistically enriched GOs and pathways. C, D The Venn diagrams show the number of the common genes between the ISO-specific upregulated and downregulated genes at day1 in IMR90 hiPSCs, respectively, and in the Retinoids specific genes in SBAD2 as shown in A and B commonly down- and upregulated genes: 12 and 57 respectively). E The heatmap shows the 31 down- and upregulated genes out of the 69 differential expressed common genes (12 and 57) with a log2FC value higher than 1. On the x-axis are the abbreviations of the teratogens and non-teratogens (Table 1 in ref. [24]) and on the y-axis the 31 commonly deregulated genes. F Metascape analysis of the 31 selected genes showing prominent enriched BPs and pathways colored by p-values.
The overlapping up- or downregulated SPS at day1 as compared to the control conditions, we identified 31 downregulated (Fig. 5A) and 100 upregulated (Fig. 5B) common genes between all three retinoids at day1 in the differentiating SBAD2 hiPSCs as compared to control cells after reanalyzing the day1 SBAD2 hiPSCs transcriptome data [24]. Further analysis across the common retinoid compounds SBAD2 hiPSCs day1 data and the IMR90 hiPSCs day1 ISO data resulted in 69 common genes, among them 12 downregulated (Fig. 5C) and 57 upregulated (Fig. 5D) between all three retinoids at day1 of differentiation.
Among these genes, we selected 31 genes of key biologically significant and highly deregulated (Fig. 5E) (at least 2fold up- or downregulated). The expression levels of these genes across all the teratogens and non-teratogens are shown in the heatmap (Fig. 5E). The heatmap indicates a clear separation of retinoid, teratogens and non-teratogens making these genes strong candidates for potential cardiac mesodermal markers, which are essential for cardiac development. The enriched GO analysis of these genes by Metascape revealed significant developmental processes, such as embryonic organ development, heart development, angiogenesis and regulation of WNT signaling pathway (Fig. 5F).
Impact of teratogens and non-teratogens on beating activity of the cardiomyocytes
We further carried out a general assessment of cardiomyocyte differentiation until day14 based on the beating activity of the SBAD2 and IMR90 CMs as compared to the control CMs. Among all teratogens tested with the UKK2-CTT, only the retinoids completely inhibited the formation of beating cardiomyocytes at day14, whereas treatment with the non-teratogens had no effects on the beating frequency of the cardiomyocytes at day14 (Fig. 6A–F). To focus on well-documented teratogens such as VPA and THD on the cardiomyogenesis process we generated a live imaging transgenic IMR90 hiPSCs cell line using the CRISPR-Cas9 and a homology-directed recombination approach as we described previously [2, 28]. The ACTN2-cop green fluorescent protein (ACTN2-cop-eGFP+-hiPSC line (IMR90 origin) enables the live imaging of sarcomeres after differentiation to ACTN2-cop-eGFP+-CMs, since the α-cardiac specific actinin (ACTN2) is enriched in the sarcomeres, the smallest contractile unit of cardiomyocytes.
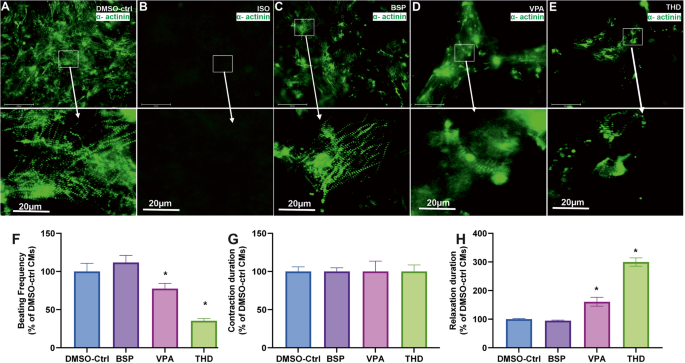
A–C, E Representative immunofluorescence live imaging of sarcomeric ACTN2-copGFP+-CMs at day14 obtained after differentiation of IMR90 ACTN2 copGFP+-hiPScCs on day14 in the absence and presence of ISO, VPA, BSP and THD, respectively (Scale bar: 100 μm (original) and 20 µm (magnified)), arrows indicate the sarcomere striation morphology. F–H The diagrams show the beating frequency, the contraction and the relaxation duration at day14, respectively, for control, BSB, VPA and THD. The values are expressed as a percentage of the control CMs values, which were set to 100%. (mean ± SEM, n = 3, *p < 0.05).
As illustrated in Fig. 6A the control day14 ACTN2-cop-eGFP+-CMs show an intact muscle striation structure and a beating activity of 65 beats per min (Supplementary Video S1). As expected, no cardiomyocytes were observed at day14 in the presence of ISO (Fig. 6B). The top 50 deregulated genes visualized in a heat map (Supplementary Fig. S6A) reflect the influence of ISO on the transcriptome on day14 and the absence of any cardiac markers. The non-teratogen BSP did neither affect the striation structure of the CMs nor the beating activity (Fig. 6C and Supplementary Video S2). However, VPA and THD compromised the cardiac muscle striation of ACTN2-cop-eGFP+-hiPSC (Fig. 6D, E, respectively) and reduced the beating activity as compared to control, BSP and other non-teratogens. Using the software VA1.9 [2, 28], we also analyzed the beating frequency and the fluctuations of the contraction and relaxation velocity of the differentiated cardiomyocytes on day14, as has already been described [2, 28]. As shown in Fig. 6F, VPA and THD exposed CMs resulted in decreased beating frequency when compared to control and the non-teratogen BSP. There was no significant change in the contraction velocity, in contrast to the relaxation phase that was drastically increased in VPA and almost 3 times more in THD (Fig. 6E, G).
In general, to identify a teratogen that specifically inhibits cardiac development based on the retinoids gene signature, we defined the “Cardiac Developmental Index” (CDI31g). This index has a maximal value of 1 for the retinoid compounds (=no of deregulated genes divided by 31 deregulated genes). In the case that no gene is differentially expressed the CDI31g value for the compound has a minimum value of zero. Therefore, all three retinoids deregulated the expression of 31 developmental-related genes (5 down- and 26 up-regulated, in the SBAD2 cell line). When compared to the non-teratogens, the teratogens yielded in a higher CDI31g score. The teratogens VPA and THD showed 12 and 10 deregulated genes, with CDI31g scores of 0.38 and 0.32 respectively (Table 1). The distribution of these genes in IMR90 cell line (Supplementary Fig. S6B) confirmed their high deregulation when compared to the other two teratogens (VPA and THD) and the non-teratogen, BSP. The live cell imagining revealed the deterioration of the sarcomeric a-actinin and the irregular structure of the actinin filaments in VPA (Fig. 6D) and THD (Fig. 6E) treated conditions when compared to untreated cardiomyocytes. The non-teratogen BSP did not affect the beating activity and muscle striation. Accordingly, a CDI score of 0 was calculated.

